What is thinkscript and how can it help your trading
We may earn commissions from the companies mentioned in this post. View our FTC disclosure for more information.
ThinkScript is a programming language used to develop and customize trading indicators, strategies, and scans for the thinkorswim trading platform. Thinkorswim is a platform that allows users to trade stocks, options, futures, and forex markets.
ThinkScript is based on the Java programming language and is used to create custom technical indicators, custom scans, and custom trading strategies. The language allows users to write custom scripts that can be used to analyze price and volume data, and to create alerts and notifications when specific market conditions are met.
ThinkScript has a wide range of built-in functions and operators that can be used to manipulate data and perform calculations, and it also allows users to create their own functions and variables. The language is widely used by traders and investors who want to customize their trading experience and create their own trading tools.
Here are some examples of thinkScript studies that can be used in the thinkorswim platform:
- Moving Average Crossover: This study is used to identify when a shorter-term moving average crosses above or below a longer-term moving average, which can indicate a potential trend reversal.
- Relative Strength Index (RSI): RSI is a momentum indicator that measures the speed and change of price movements. This study can be used to identify overbought or oversold conditions in the market.
- Bollinger Bands: Bollinger Bands are used to measure the volatility of a stock’s price relative to its moving average. This study can help traders identify potential buy or sell signals based on the price moving outside of the bands.
- Fibonacci Retracement: This study uses Fibonacci ratios to identify potential levels of support and resistance in a stock’s price movement.
- Volume Weighted Average Price (VWAP): This study is used to calculate the average price of a stock’s trading volume, which can be used as a reference point for determining whether a stock is trading above or below its average volume-weighted price.
- MACD: The Moving Average Convergence Divergence (MACD) is a trend-following momentum indicator that can help traders identify potential trend reversals.
- Ichimoku Cloud: This study combines multiple indicators to create a visual representation of support and resistance levels, trend direction, and momentum.
These are just a few examples of the many thinkScript studies that are available in thinkorswim. Traders and investors can use these studies to gain insights into market trends and make more informed trading decisions.
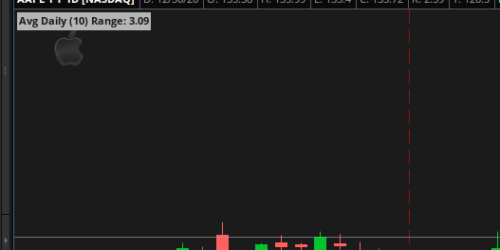
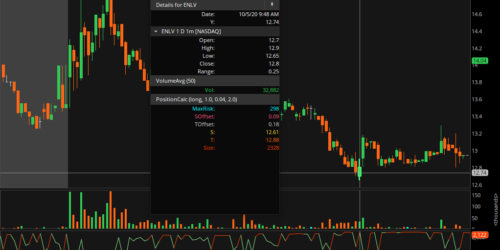
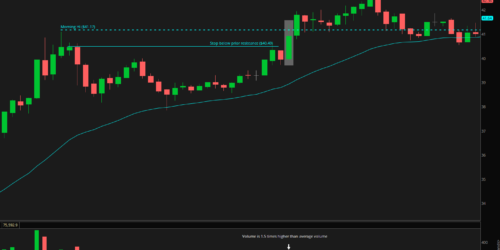
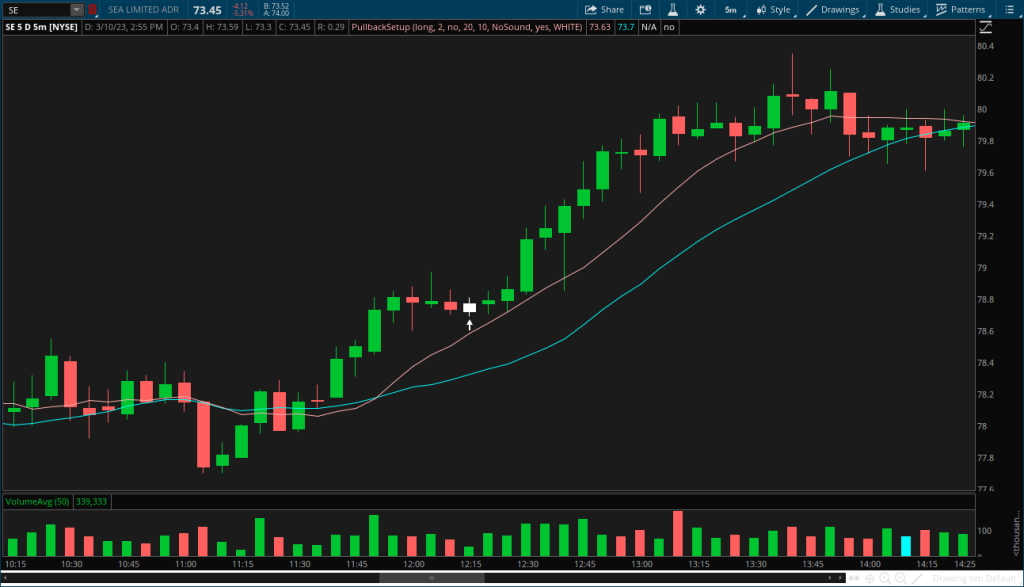
Some indicators that are not available out of the box are things like a pullback indicator, average daily trading range, opening range breakout (ORB), and several other popular trading strategies. There are a few businesses out there that create custom thinkscript indicators for using the the thinkorswim platform so regardless of your programming skills, you should be able to find the trading tools that you need.