Best time to place a 5 Minute ORB stop-limit order

We may earn commissions from the companies mentioned in this post. View our FTC disclosure for more information.
Disclaimer: There is a high degree of risk involved in trading. Past results are not indicative of future returns. ManThings.net and all individuals affiliated with this site assume no responsibility for your trading and investment results. The indicators, strategies, columns, articles and all other features are for educational purposes only and should not be construed as investment advice.
Update 01/25/2022: The new ORB indicator for thinkorswim is available at https://TradeForMe.money. The automated ORB strategy is also available for the tech nerds out there. Happy trading everyone!
Update 04/03/2021: I played around with my back test parameters, adding a .01, .02, .03, .04, and .05 cent pad below the stop loss and the same above the five minute high for the limit price, and it changed the results a fair amount. In addition, I set 3R AON targets to compare. The results were best with the .01 pad and 3R AON targets. Also, 10:15 is the new 10:10!
Please do your own testing before implementing any trading strategy. Thanks for reading!
It’s no secret that every trading strategy must be back tested before implementation. The trouble is, with so many variables, it’s almost impossible to find the best and most profitable strategy even if you’ve watched every YouTube video and read every article on the internet about it. What’s more, if you’re not a programmer, it is extremely difficult to back test the multitude of strategies out there that folks tout as the best and most profitable. Well, I happen to be a programmer and I’ve been working on a means of testing various strategies programmatically using my own watchlists from the last six months. In this blog post I will share with you the results of one such test, and tell you how I plan to use my findings to print money from the U.S. stock market month after month, and year after year. If you’re interested, I can even provide to you my watchlists, databases, and scripts used for testing.
The strategy
Before you get into the strategy, please take a moment to check out Life’s a Play. It’s an album I released in August of 2020, and I would really appreciate your support! Feel free to contact me to let me know what you think…even if you think it sucks.
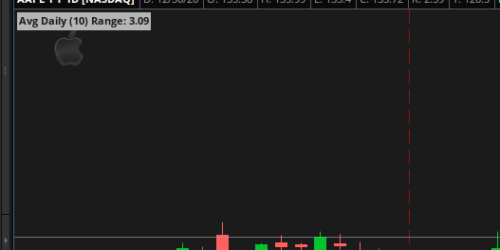
The opening range breakout strategy (ORB) is a popular strategy that’s been around for some time. I’m not going to go into details about all of the various ways it’s been used or the “usual” criteria used to enter these types of trades. Instead, I’m focused on the statistical probability of the trade working and the amount of profits (or losses) it can bring if it’s used consistently with the criteria that I use on a daily basis. The scan criteria are listed in my previous blog post about trading the morning gappers. The morning gap list is important to many traders as it provides us with a list of stocks that have a higher than usual volume of interest. Whether the stock is gapping up or down, we know that there’s some institutional interest in the stock, and that gives us retail traders a hint to potential stocks in play for the day. The strategy itself does not rely on fundamental or technical analysis but instead the statistical probability of a particular type of trade being profitable.
For months I have woken up every trading day and created my watchlist at 8:00am. Some people create theirs earlier, some later. The fact is the criteria for my scan and the time at which the scan runs is of significant importance. Remember, we are attempting to gain an advantage by using the statistical probability of the strategy working without ever looking a companies fundamentals or a chart pattern. Here’s how it works:
- Run the scan using the morning gapper criteria at 8:00am
- Order the results from highest to lowest volume
- Take note of the top three stocks on the list
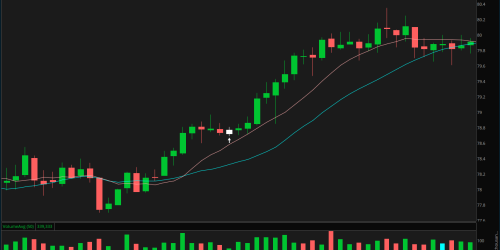
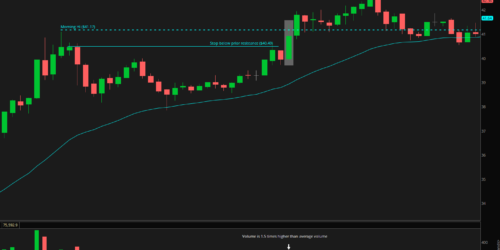
- 5 minutes after the market open, place a conditional buy stop limit order (GTC, or Good ‘Til Canceled) for each of the top three using the high of the first 5 minute candle as your entry price, the low as your stop loss, and 2x the range as your target. The condition is that the order is submitted at 10:10am (keep reading).
I broke the back test into three tests using six months of watchlists, and using the top three stocks by volume. Targets are 2R AON (all or nothing). Risk per trade is $300 (1% of a $30,000 margin account). Share size is calculated by taking the range of first 5 minute bar, adding 5 cents (for stop loss padding), and dividing that number by $300. For range bound trades that didn’t reach the target or stop during the trading day, I used the low of the last five minute candle as the exit price to calculate P/L.
The charts below show the results of submitting the order at each five minute interval for the first hour of the trading day, and the most profitable time to submit the order.
Tests:
- Placing the conditional buy stop limit order ONLY if the first 5 minute candle closed green
- Placing the conditional buy stop limit order ONLY if the first 5 minute candle closed red
- Placing the conditional buy stop limit order regardless of the color of the first 5 minute bar.
Green entry
My first test was done using the common internet wisdom that the first 5 minute candle of the day provides traders with a directional bias. The logic being that if that bar closes in the green we should take a bullish bias and trade in the direction of the gap. It’s important to consider that regardless of the color of the first bar, the stock appeared on a gap up list, so the bias should already be bullish. In this back test, a conditional buy stop limit order was only submitted if the first 5 minute candle closed in the green. The results show that the most profitable time to submit a 5 minute ORB entry if the first candle closes green is immediately after the close of the first candle.
Red entry
The second test uses the same logic, but instead of a green entry, a conditional buy stop limit order was only submitted if the first 5 minute candle closed in the red. These results seem to corroborate the common internet wisdom about the closing color of the first bar determining bias. There are decent profits if the order is submitted at 10:10am, but can we do better?
Any color bar entry
We can see clearly that profits were greater using the green entry method above, but what happens if we submit the order regardless of the color of the first 5 minute bar?
These results show a clear winner. Submitting the buy stop limit order every day at 10:10 am on the highest three volume stocks from the morning gap up list yields a 37% gain on a $30,000 margin account over the last six months. Amazing, right?! Keep in mind that this does not account for slippage or fills (or lack of fills). The numbers do reflect closing any range bound positions at the end of the day using the low of the last 5 minute candle as the exit price.
If you don’t have the stomach for intraday trading, or if you’re looking for a way to grow your account without thinking, this may be the ticket! These results come from ZERO fundamental analysis and ZERO technical analysis. They come from simply scanning for the medium float stocks gapping up in the pre-market, and blindly placing a buy stop limit order for the high of the first 5 minute candle at the same time every day. It seems ridiculous, but no more than the idea of day trading in general, lol. The keys to success here are consistency, and ALWAYS setting a target of 2x what you’re risking per trade. Of course you don’t have to use 1% of your account for the risk. I personally wouldn’t use more than $10 or $15 per trade for a few months, just to play is super safe.
If you would like to support my work, I’m always looking for ways to help make your life easier so I programmed this ORB indicator for ThinkOrSwim that plots price levels right on the chart so you can get into your trades faster (without having to do math, lol). I’m working on automating the entire process, and I’ll write another blog post with my results after I’ve ironed out all the details and had it running for a few months! (Update 12/20/2021: I built it! Learn more at https://TradeForMe.money) Thanks for reading and feel free to leave questions or comments. I’ll reply as soon as possible!


Hey great work here. Just wondering did you quantify the % probabilities for a move hitting 2R and 3R. If so could you share that?
Hi, Jesse. Thanks for your comment! I did backtests using 1R, 2R, and 3R targets. Seldom did they ever hit a 3R target using the breakout strategy. I think most likely because after breaking out from their 5 minute opening range high, they’ve already put in a significant move for the day. The 2R target was the best performing out of all the tests I ran.